Hotline: 678-408-1354

Working Women: Data from the Past, Present and Future

For Women’s History Month, we’re highlighting data from the Bureau of Labor Statistics on working women in the labor force from the past, present and future.

Past

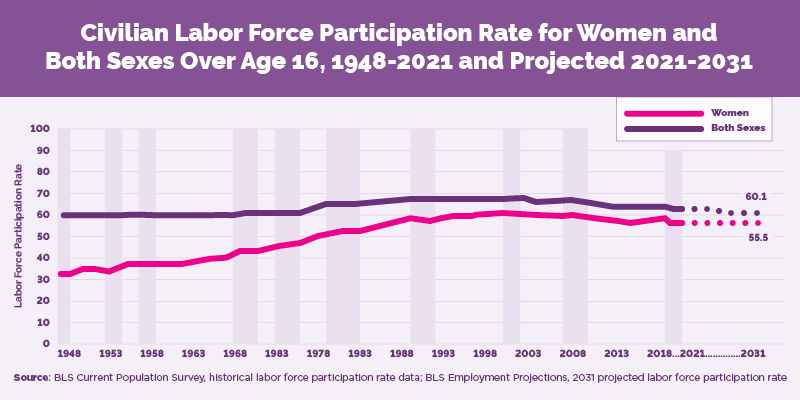
  • The entrance of women into the workforce has influenced the labor force participation rate over the last several decades.
  • Historically, women’s labor force participation rate has increased overall since 1948, peaking in 1999 around 60%.
  • Since the new millennium, the total labor force participation rate and the women’s labor force participation rate have both fallen.
Chart showing the civilian force participation rate for women and both sexes over age 16, from 1948 to 2021, and projected for 2021 to 2031.
Note: Shaded areas indicate recession. The labor force participation of women increased from 1948 until about 2000, with small dips during recessions in the early 1950s and around 1990. Since 2000, the rate for both sexes has declined slightly. Projections for 2021 to 2031 show women’s participation staying about the same and a slight decline for both sexes.

Present

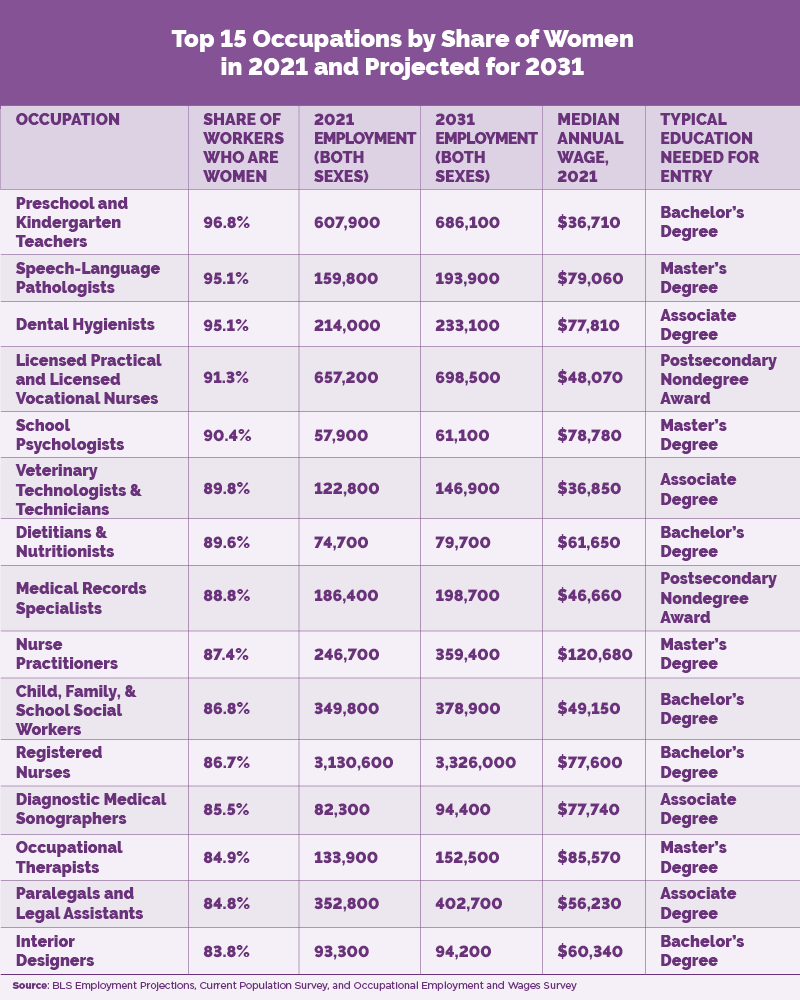
  • Occupations with a large share of women are clustered in a few occupational groups, especially in healthcare practitioners and technical occupations.
  • Of the occupations highlighted below, half are part of the healthcare diagnosing or treating practitioners group or the health technologists and technicians group.
  • All of the occupations listed below require some level of postsecondary education for entry, and just under half typically require an associate degree or higher for entry.
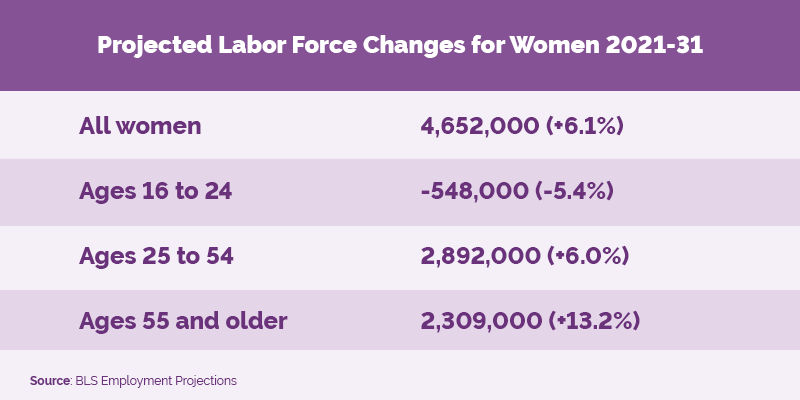
Chart showing the top 15 occupations by share of women in 2021 and projected for 2031.
The top 15 occupations by share of women are preschool and kindergarten teachers, speech language pathologists, dental hygienists, licensed practical and vocational nurses, school psychologists, veterinary technologists and technicians, dietitians and nutritionists, medical records specialists, nurse practitioners, child/family/school social workers, registered nurses, diagnostic medical sonographers, occupational therapists, paralegals and legal assistants, and interior designers. All are projected to grow through 2031. 2021 annual median wages vary, with the lowest for preschool and kindergarten teachers ($36,710) and the highest for nurse practitioners ($120,680). Educational requirements vary.

Future

Chart showing Projected Labor Force Changes for Women 2021-31.
For all women, the projected labor force change from 2021-2031 is an increase of 4,652,000 or 6.1%. For ages 16 to 24, there is a projected decrease of 548,000 or 5.4%. For ages 25-54, there is a projected increase of 2,892,000 or 6.0%. For ages 55 and older, there is a projected increase of 2,309,000 or 13.2%.

Christine Machovec is an economist in the Department of Labor’s Bureau of Labor Statistics. Follow BLS on Twitter at @BLS_gov.

Editor’s note: All data in the second chart except for the percent of each occupation that are women are from the BLS Employment Projections program. The share of women workers by occupation in 2021 is from the Current Population Survey program, and the wage data is from the Occupational Employment and Wages Survey program. 

Sourced from Us Dept of Labor

Leave your thoughts

Contact Us

Eltas EnterPrises Inc.
3978 Windgrove Crossing
Suite 200A
Suwanee, Georgia
30024, USA
contact@eltasjobs.com

Subscribe to our Newsletter