

While Asian American, Native Hawaiian and Pacific Islander women are often referred to collectively, they are far from a monolithic group. Instead, the AANHPI population includes many groups with varying demographic profiles, histories and experiences in the U.S. Some have resided here for a century, while others have a much more recent immigrant experience. Some came to this country to attain a higher education, while others arrived as refugees with perhaps nothing but the clothes on their backs. Many live and work in California and Hawaii, while others are scattered across the nation.
At the Women’s Bureau, we believe one way to help AANHPI communities is through data-driven storytelling. As we celebrate the cultural diversity of Asian Americans, Native Hawaiians and other Pacific Islanders this May, here are some key statistics about the 8.5 million AANHPI women in the U.S., more than 5 million of whom are in the labor force.
1. Labor force participation rates vary significantly within AANHPI groups.
Two-thirds of Filipinas were in the labor force in 2019, compared with about half of Japanese American women, and 59% of all women.
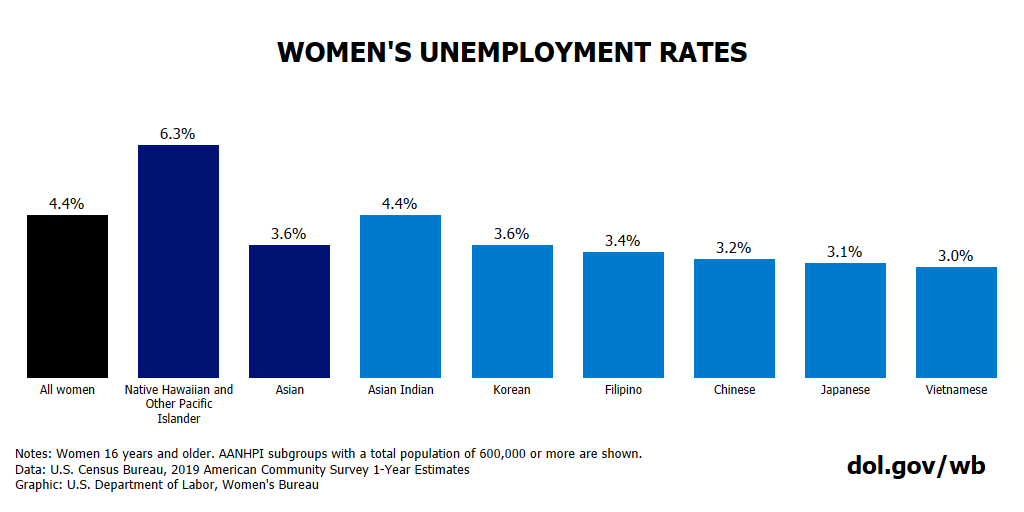
2. Unemployment rates also varied significantly.
Among AANHPI women in the labor force, the share that were unemployed was the highest among Pacific Islanders (6.3%). Unemployment rates were about half as high for Vietnamese, Japanese and Chinese women. In comparison, 4.4% of all U.S. women in the labor force were unemployed in 2019.
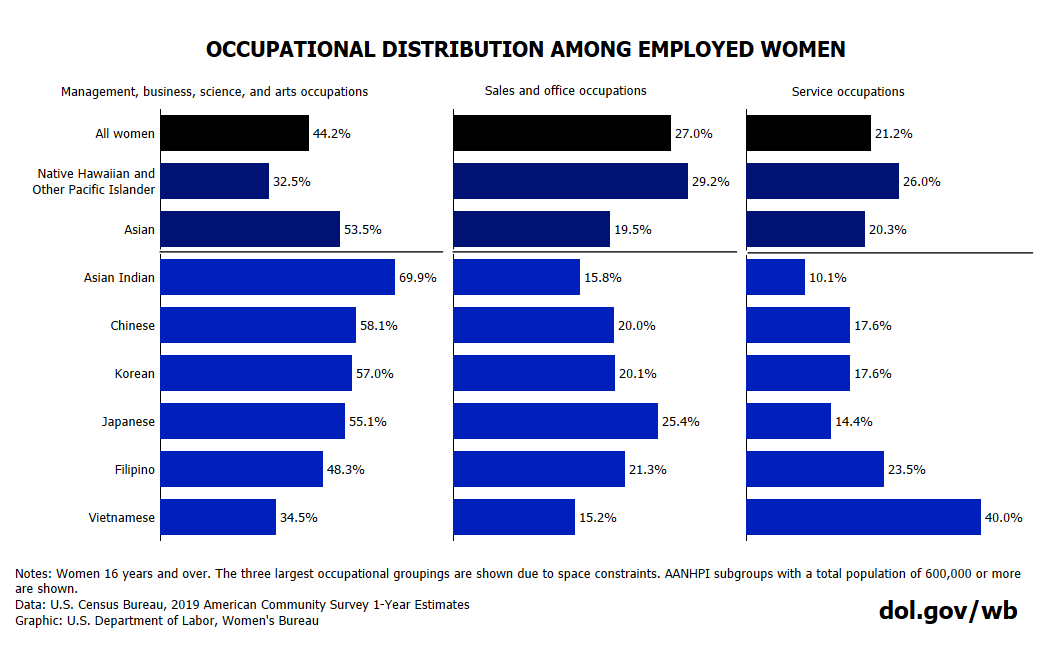
3. The occupational profiles of AANHPI women in the U.S. varied dramatically.
While 70% of employed Asian Indian women work in management, business, science and the arts, the share of Pacific Islander women and Vietnamese American women who do so is only half as high. Meanwhile, relatively large shares of these two groups are employed in service and sales.
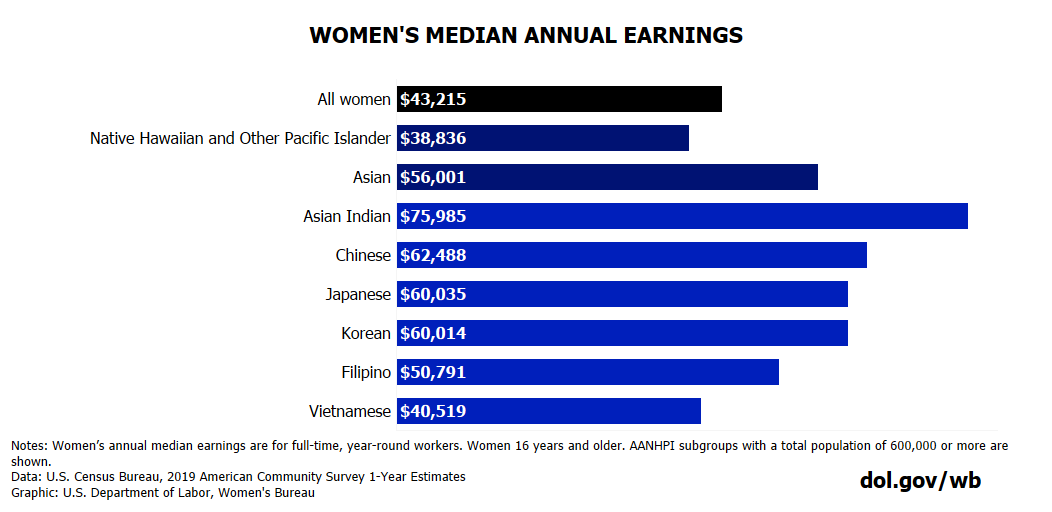
4. Differences in occupational composition across subgroups likely explain dramatic earnings differences.
Indian American women, who were concentrated in managerial and professional occupations, have median annual earnings of about $76,000. Pacific Islander and Vietnamese American women, who were concentrated in sales and service occupations, have the lowest median wages ($38,900 and $40,500, respectively). To put this in perspective, the median wage is $43,200 for all women employed full time.
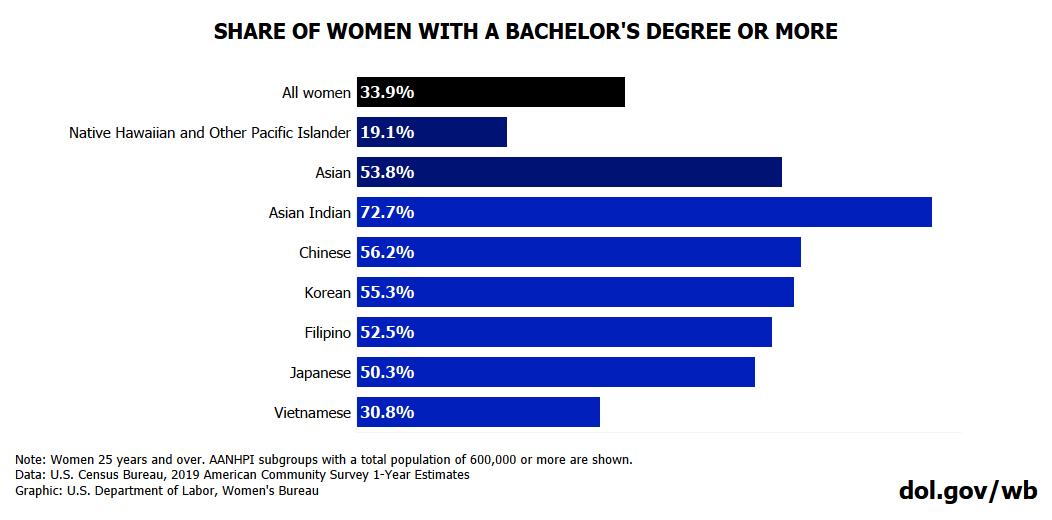
5. Underlying many of these labor force differences are stark educational differences.
While almost three-fourths of Asian Indian women have earned at least a bachelor’s degree, the same is true for only 31% of Vietnamese and 19% of Pacific Islander women. On the flip side, the share of women who lack a high school diploma ranges from 27% among Vietnamese American women to 5% among Japanese American women.
Even looking only at the largest AANHPI groups in the U.S., we see tremendous diversity. Recognizing this diversity can help us develop more effective policies and programmatic interventions across these communities. Thinking of AANHPI women as one group masks their vastly different experiences in the U.S. labor force. Breaking down the data is one way we’re helping AANHPI working women and making their voices heard.
Hari Chon is a policy analyst and Gretchen Livingston is a survey statistician at the U.S. Department of Labor’s Women’s Bureau. Follow the bureau on Twitter at @WB_DOL.
Technical note on Asian Americans and Native Hawaiian and Pacific Islanders:
These analyses are based on the following single-race classifications:
Asian: a person having origins in any of the original peoples of the Far East, Southeast Asia or the Indian subcontinent including, for example, Cambodia, China, India, Japan, Korea, Malaysia, Pakistan, the Philippine Islands, Thailand and Vietnam. It includes people who indicate their race as “Asian Indian,” “Chinese,” “Filipino,” “Korean,” “Japanese,” “Vietnamese” and “Other Asian” or provide other detailed Asian responses.
Native Hawaiian and Other Pacific Islander: a person having origins in any of the original peoples of Hawaii, Guam, Samoa or other Pacific Islands. It includes people who indicate their race as “Native Hawaiian,” “Guamanian or Chamorro,” “Samoan” and “Other Pacific Islander” or provide other detailed Pacific Islander responses.
|
Women’s labor force participation rates |
|
|
Race and ethnicity |
LFP rate |
|
All women |
58.6 |
|
Asian |
60.0 |
|
Asian Indian |
59.4 |
|
Chinese |
58.6 |
|
Filipino |
66.2 |
|
Japanese |
49.0 |
|
Korean |
55.2 |
|
Vietnamese |
63.1 |
|
Native Hawaiian and Other Pacific Islander |
61.2 |
Notes: Women 16 years and older. AANHPI subgroups with a total population of 600,000 or more are shown. Data: U.S. Census Bureau, 2019 American Community Survey 1-Year Estimates
|
Women’s unemployment rates |
|
|
Race and ethnicity |
rate |
|
All women |
4.4 |
|
Asian |
3.6 |
|
Asian Indian |
4.4 |
|
Chinese |
3.2 |
|
Filipino |
3.4 |
|
Japanese |
3.1 |
|
Korean |
3.6 |
|
Vietnamese |
3.0 |
|
Native Hawaiian and Other Pacific Islander |
6.3 |
Notes: Women 16 years and over. AANHPI subgroups with a total population of 600,000 or more are shown. Data: U.S. Census Bureau, 2019 American Community Survey 1-Year Estimates
|
Occupational distribution among employed women |
|||
|
Race and ethnicity |
Management, business, science, and arts occupations |
Service occupations |
Sales and office occupations |
|
Native Hawaiian and Other Pacific Islander |
32.5 |
26.0 |
29.2 |
|
Vietnamese |
34.5 |
40.0 |
15.2 |
|
All women |
44.2 |
21.2 |
27.0 |
|
Filipino |
48.3 |
23.5 |
21.3 |
|
Asian |
53.5 |
20.3 |
19.5 |
|
Korean |
57.0 |
17.6 |
20.1 |
|
Japanese |
55.1 |
14.4 |
25.4 |
|
Chinese |
58.1 |
17.6 |
20.0 |
|
Asian Indian |
69.9 |
10.1 |
15.8 |
Notes: Women 16 years and over. The three largest occupational groupings are shown. AANHPI subgroups with a total population of 600,000 or more are shown. Data: U.S. Census Bureau, 2019 American Community Survey 1-Year Estimates
|
Women’s median annual earnings |
|
|
Race |
Median earnings |
|
All women |
$43,215 |
|
Asian |
$56,001 |
|
Asian Indian |
$75,985 |
|
Chinese |
$62,488 |
|
Filipino |
$50,791 |
|
Japanese |
$60,035 |
|
Korean |
$60,014 |
|
Vietnamese |
$40,519 |
|
Native Hawaiian and Other Pacific Islander |
$38,836 |
Notes: Women’s annual median earnings are for full-time, year-round workers. Women 16 years and older. AANHPI subgroups with a total population of 600,000 or more are shown. Data: U.S. Census Bureau, 2019 American Community Survey 1-Year Estimates
|
Share of women with a bachelor’s degree or more |
|
|
Race |
Bachelor’s degree or higher |
|
All women |
33.9 |
|
Asian |
53.8 |
|
Asian Indian |
72.7 |
|
Chinese |
56.2 |
|
Filipino |
52.5 |
|
Japanese |
50.3 |
|
Korean |
55.3 |
|
Vietnamese |
30.8 |
|
Native Hawaiian and Other Pacific Islander |
19.1 |
Note: Women 25 years and over. AANHPI subgroups with a total population of 600,000 or more are shown. Data: U.S. Census Bureau, 2019 American Community Survey 1-Year Estimates
