Hotline: 678-408-1354

Data Spotlight: Employment of Black Workers with Disabilities in Skilled Trade Professions  

How many Black workers with disabilities are working in skilled trade professions? 

A core goal of the Biden administration’s Good Jobs Initiative is to increase equitable pathways to good jobs in infrastructure for underrepresented groups including women, people of color and individuals with disabilities. Many infrastructure jobs, such as those in skilled trade professions, have training requirements that are shorter than a typical four-year degree program, allowing quicker entry into the workforce.  

To gain a better understanding of how many Black workers with disabilities are currently working in infrastructure jobs, we analyzed Census data on Black workers with disabilities working in skilled trade professions.  

There are approximately 1,160,000 Black adults with disabilities in the workforce, and of these adults, an estimated 270,000 (or 23.6%) are working in skilled trade professions. Skilled trade jobs are critical for maintaining everyday infrastructure and include the following major occupation groups: 

  • Farming, Fishing and Forestry  

  • Construction and Extraction 

  • Installation, Maintenance and Repair 

  • Production 

  • Transportation and Material Moving 

These data were extracted from the Census Bureau’s American Community Survey for 2017 through 2021. The industry codes are derived from the Standard Occupational Classification System (SOC), which is a federal statistical standard that is used to group workers into different occupations based on job titles.  

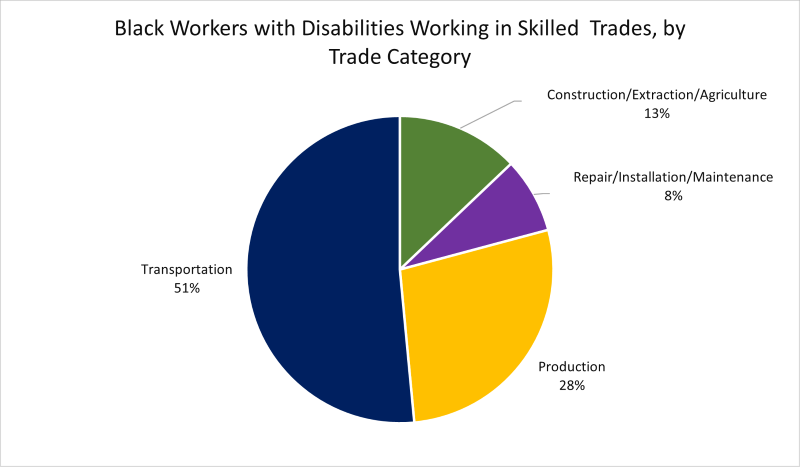
Data highlight: Among Black workers with disabilities, 23.6% are working in skilled trades. Of disabled Black adults working in skilled trade professions, the largest proportion are working in Transportation at 51%. 

A pie chart titled "Black Workers with Disabilities Working in Skilled Trades, by Trade Category."
The pie chart shows that most disabled Black workers in the skilled trades work in Transportation at 51%. The next most common trade category is Production at 28%, followed by Construction/Extraction/Agriculture at 13% and Repair/Installation/Maintenance at 8%. 

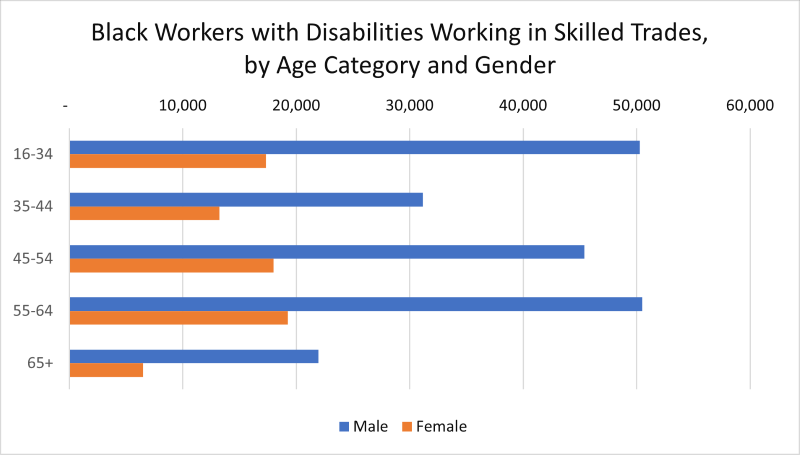
Data highlight: Women make up slightly over one-quarter (27.2%) of Black workers with disabilities working in trades, a proportion that is fairly consistent across different age groups.

A bar chart titled "Black Workers with Disabilities Working in Skilled Trades, by Age Category and Gender." 
A bar chart shows data disaggregated by age and gender for Black workers with disabilities in skilled trades. Overall, the age group with the most disabled Black men and women who are working in skilled trades is ages 55-64. For each age category, Black men with disabilities outnumber Black women with disabilities working in skilled trades, and the overall proportion of disabled Black women working in skilled trades compared to disabled Black men is slightly over one-quarter.  

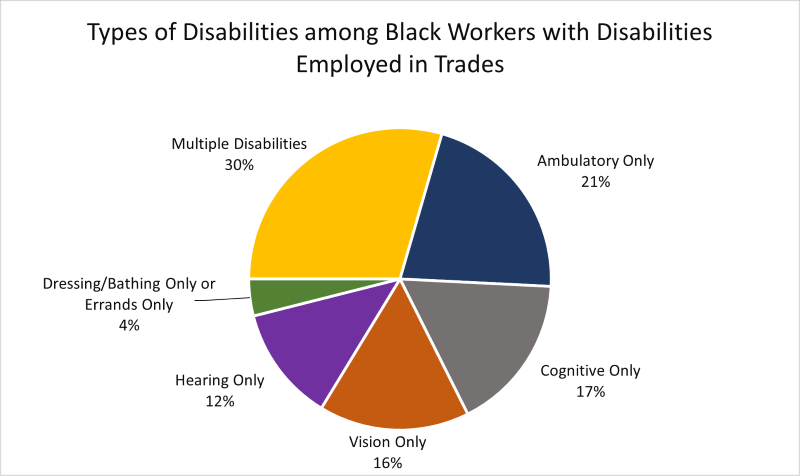
Data highlight: One-third of Black workers with disabilities report having multiple concurrent disabilities. For Black workers reporting only one type of disability, the most commonly reported disability is ambulatory difficulties, which is reported by 21% of Black workers who report having only one type of disability.  

A pie chart titled "Types of Disabilities among Black Workers with Disabilities Employed in Trades." 
The pie chart shows the proportions of different types of disabilities reported by Black disabled workers in trade professions. The largest section of the pie chart is disabled Black workers who report having multiple disabilities at 30%, followed by ambulatory disability (21%), cognitive disability (17%), vision disability (16%), hearing disability (12%) and  dressing/bathing or errands difficulties (4%). 

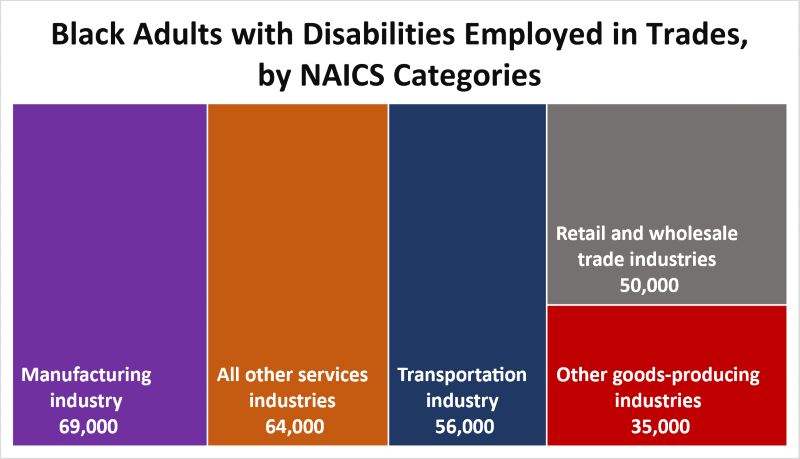
Data highlight: A detailed look at the distribution of trade professions across industries using the North American Industry Classification System (NAICS) shows that most Black workers with disabilities are working in the Manufacturing, Services and Transportation industries. 

A tree chart titled "Black Adults with Disabilities Employed in Trades, by NAICS Categories." 
A tree chart shows which industries employ Black adults with disabilities in the trades, with 69,000 in manufacturing, 64,000 in all other services, 56,000 in transportation, 50,000 in retail and wholesale trade, and 35,000 in other goods-producing industries. 

Data highlight: The trade industry category with the smallest wage gap between Black workers with and without disabilities is Repair/Installation/Maintenance. Note: These data include employees who are full-time (usually worked at least 35 hours per week), worked at least 50 weeks in the last year, and have positive earnings. 

A bar chart titled "Mean Annual Wages, by Disability Status and Occupational Category". 
This bar chart shows the mean annual wages for different skilled trade profession categories as well as non-trade categories for Black workers with and without disabilities. The bars on the chart for each category compare the wages for disabled Black workers vs. non-disabled Black workers. Overall, the wage gap between Black workers with disabilities and Black workers without disabilities working in Repair/Installation/Maintenance is smaller than the wage gap between these groups for other trade categories (such as Transportation) and non-trade categories. 

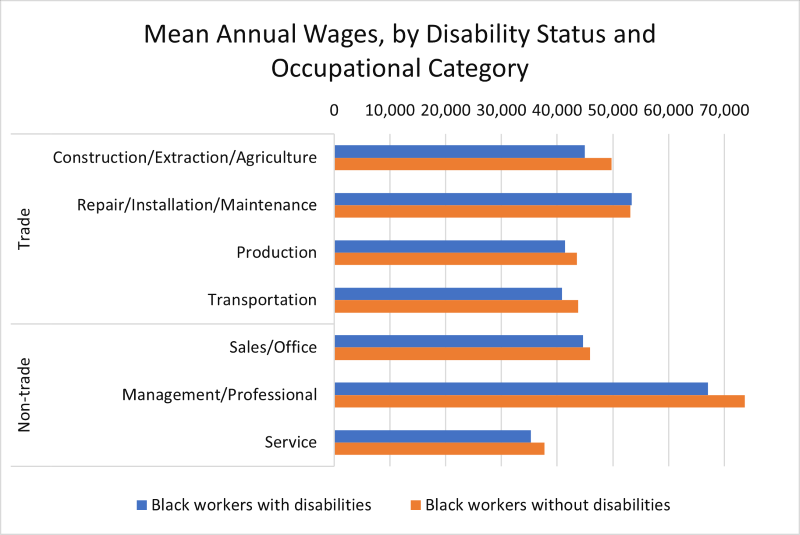
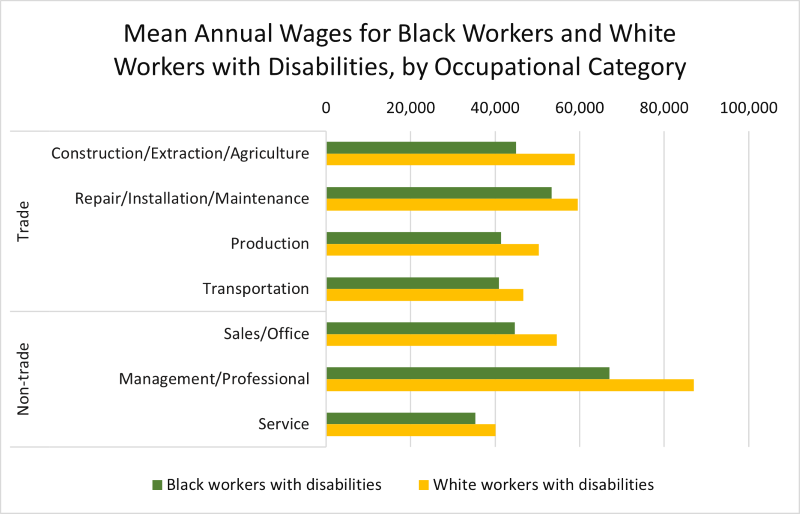
Data highlight: Across all occupational categories, including both trade and non-trade categories, White workers with disabilities have higher mean wages than Black workers with disabilities. Note: These data include employees who are full-time (usually worked at least 35 hours per week), worked at least 50 weeks in the last year, and have positive earnings. 

A bar chart titled "Mean Annual Wages for Black Workers and White Workers with Disabilities, by Occupational Category." 
This is a bar chart showing wage gaps between Black workers with disabilities and White workers with disabilities in different occupational categories, including both trade and non-trade professions. The largest wage gap between Black and White workers with disabilities exists in a non-trade occupation category (Management/Professional occupations). The smallest wage gap between Black and White workers with disabilities exists in a trade occupation category (Repair/Installation/Maintenance). 


David Rosenblum is a senior economist and Alexandra Ruth is a data scientist in the department’s Office of Disability Employment Policy.  

Sourced from Us Dept of Labor

Leave your thoughts

Contact Us

Eltas EnterPrises Inc.
3978 Windgrove Crossing
Suite 200A
Suwanee, Georgia
30024, USA
contact@eltasjobs.com

Subscribe to our Newsletter